I analyzed pixel-level behavior of a GomSpace NanoCam C1U to assess its suitability for scientific nanosatellite missions. Handling 151 million pixels, I combined optical experiments with Python-based data processing, producing detailed spatial maps and insights that guide accurate image correction and instrument evaluation.
Lorem ipsum dolor sit amet, consectetur adipiscing elit. Suspendisse varius enim in eros elementum tristique.
Lorem ipsum dolor sit amet, consectetur adipiscing elit. Suspendisse varius enim in eros elementum tristique.
Lorem ipsum dolor sit amet, consectetur adipiscing elit. Suspendisse varius enim in eros elementum tristique.
Lorem ipsum dolor sit amet, consectetur adipiscing elit. Suspendisse varius enim in eros elementum tristique.
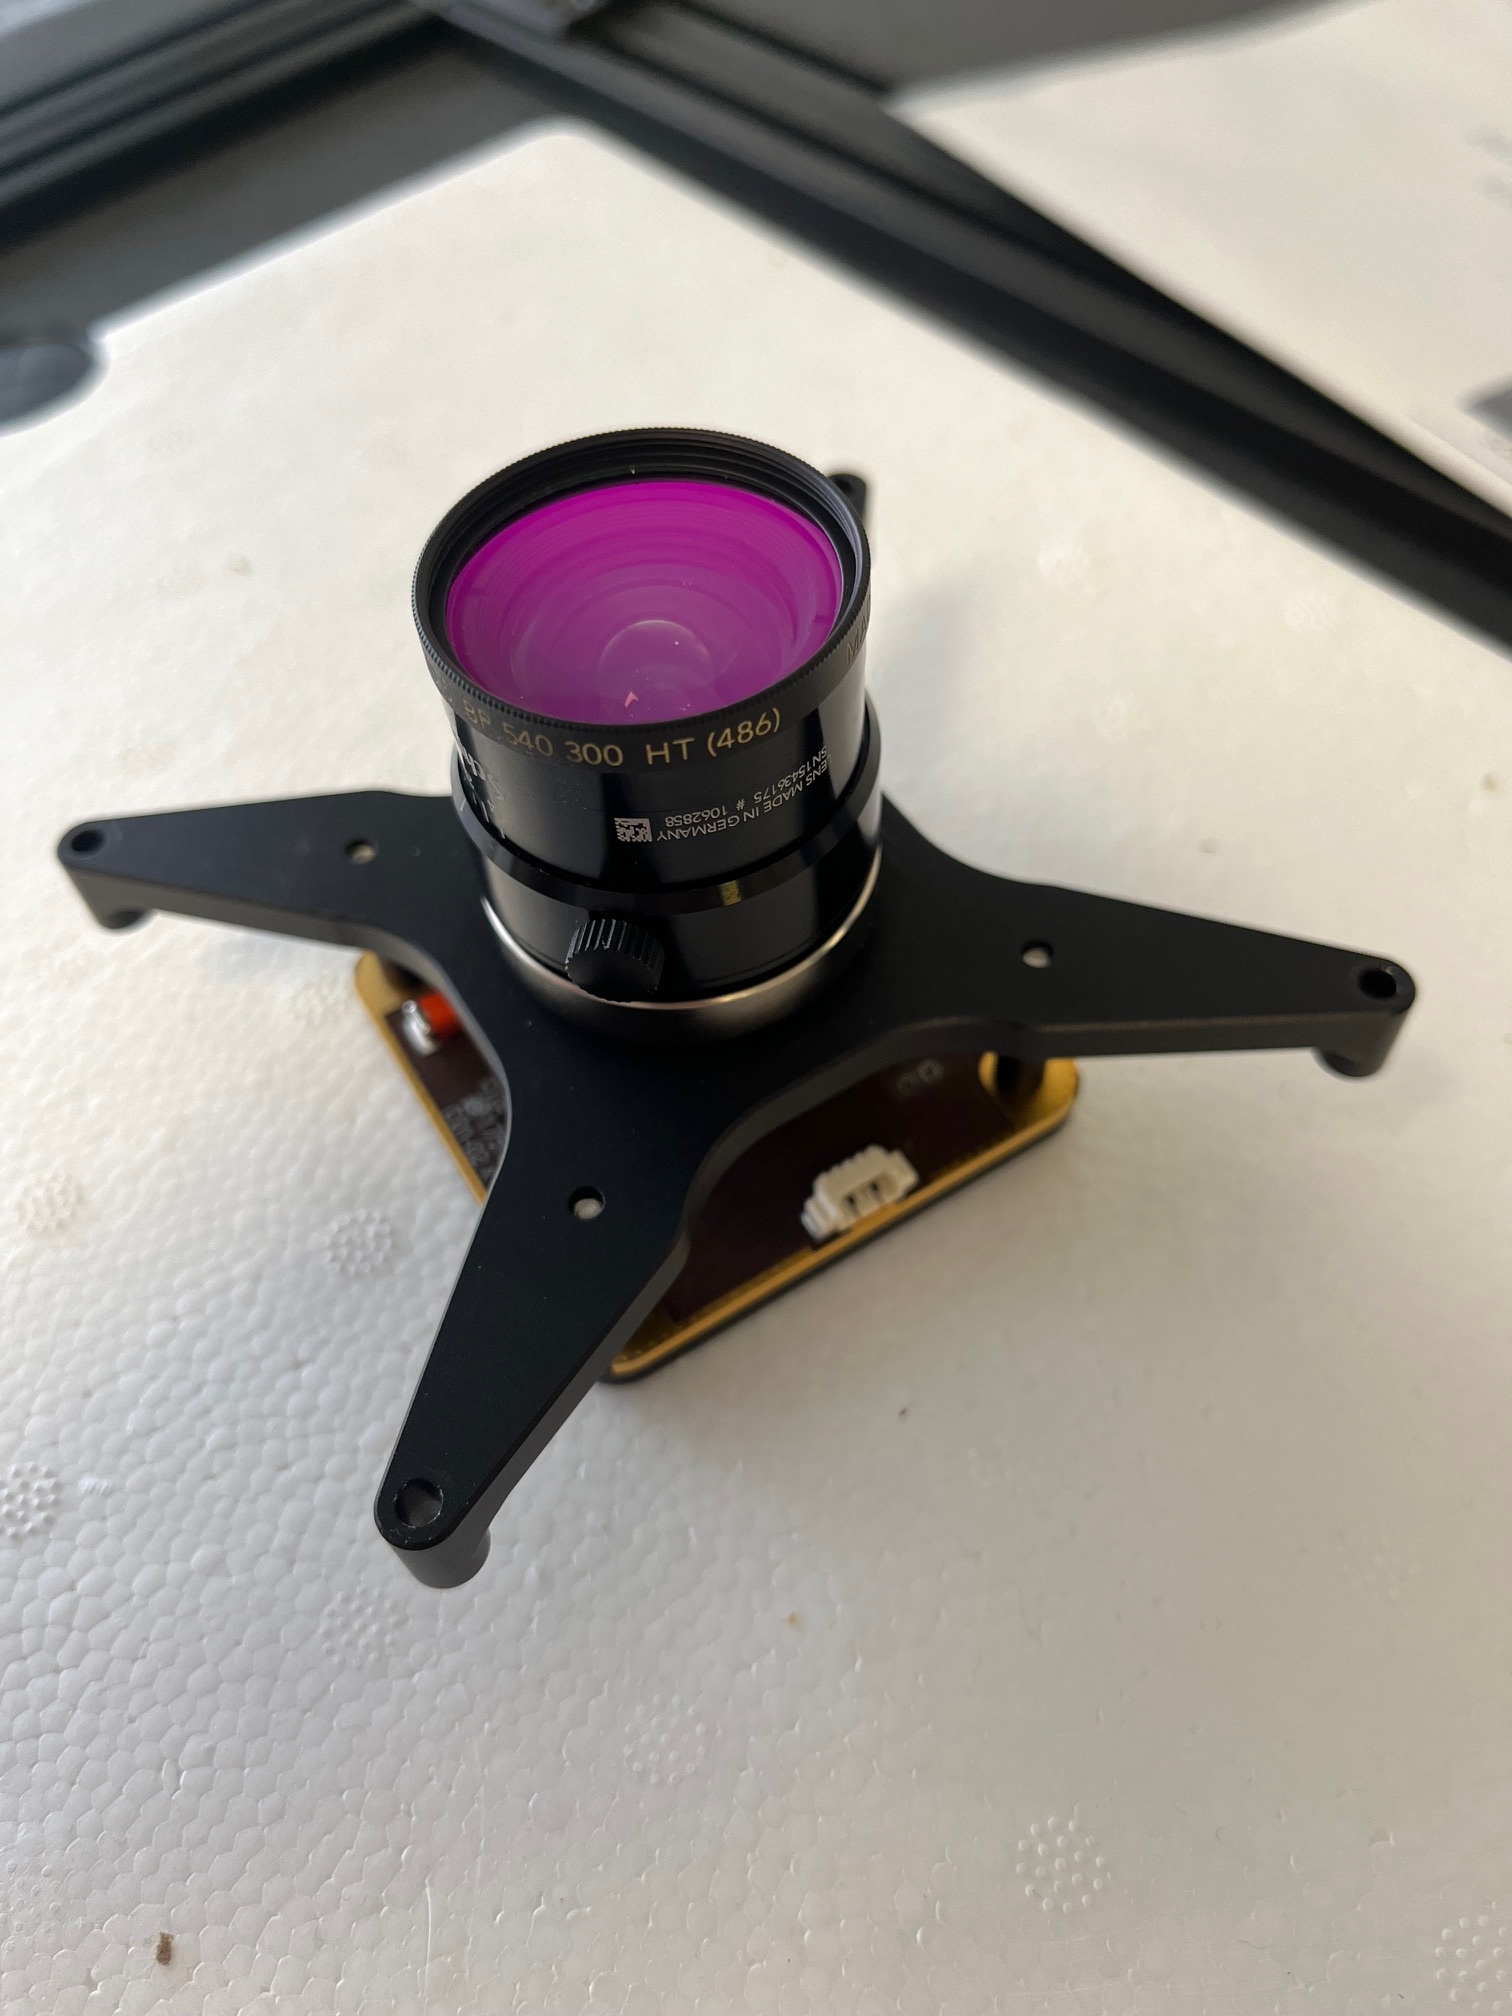
As part of a LIU within the CENSUS team (Paris Observatory – PSL), I worked in a pair on the characterization of a nanosatellite camera (GomSpace NanoCam C1U) designed for nanosatellite missions. The objective was to measure and map pixel-by-pixel offset and dark current, in order to evaluate image correction capabilities and assess the instrument’s suitability for scientific applications (ADCS / imaging).
Previous studies had only provided average values of offset and dark current, lacking spatial resolution. Our goal was to go further: to produce spatial maps of both offset and dark current (a value pair per pixel), thereby enabling more accurate image correction and diagnosing non-uniform effects (hot pixels, gradients, readout artifacts).
Measurements were performed on an optical bench under controlled conditions. We acquired 16 integration times ranging from 75 μs to 1.5 s, with 3 images per integration time (48 images in total) — representing ~151 million pixels to process. The raw format (RAW10) required specific preprocessing to extract the 10 effective bits per pixel.
I developed and used two Python scripts: one to extract and average the .raw files into matrices per integration time, and another to perform, pixel by pixel, a linear fit of signal values (ADU versus integration time). From this fit, the slope = dark current (ADU/s) and the intercept = offset (ADU) were derived. The results were analyzed through histograms and spatial maps.
Several factors (thermal variability, insufficient cooling, low photocurrent, shutterless readout) may explain the anomalies, while alternative tests did not resolve them, highlighting the need for further campaigns to clarify negative values and spatial variations.
This project allowed me to combine instrumentation (optical bench), low-level raw data processing, and large-scale statistical analysis (~1.5×10^8 pixels processed). I strengthened my skills in experimental acquisition, binary extraction of RAW formats, Python scripting for massive data processing, and instrumental interpretation — highly valuable skills for nanosatellite instrument integration and scientific data analysis.
Download the full project report for in-depth technical documentation and detailed findings.
![image of engineers working on satellite components [team]](https://cdn.prod.website-files.com/68b8a2f09cb5f6e554409260/68b8a3ecd3664c93e0359dc2_689ee53f67ac4978db628dbc_Capture%2520d%25E2%2580%2599e%25CC%2581cran%25202025-08-13%2520a%25CC%2580%252007.17.58.png)
![image of engineers working on satellite components [team]](https://cdn.prod.website-files.com/68b8a2f09cb5f6e554409260/68b8a3ecd3664c93e0359dba_689ee53fbf92e7656c34b7d6_Capture%2520d%25E2%2580%2599e%25CC%2581cran%25202025-08-13%2520a%25CC%2580%252007.18.13.png)
![image of engineers working on satellite components [team]](https://cdn.prod.website-files.com/68b8a2f09cb5f6e554409260/68b8a3ecd3664c93e0359db6_689ee53e44aa89ba9c20a5b7_IMG_3267.jpeg)
![image of engineers working on satellite components [team]](https://cdn.prod.website-files.com/68b8a2f09cb5f6e554409260/68b8a3ecd3664c93e0359dc8_689ee56f68bd14f0a447bb16_Capture%2520d%25E2%2580%2599e%25CC%2581cran%25202025-08-13%2520a%25CC%2580%252007.20.02.jpeg)